Topic detection and sentiment analysis for business people using sandsiv+ Customer Intelligence solution in 57 different languages. In this post, using a dataset public available on kaggle.com, I will analyze 15’928 reviews of Disneyland Paris guests coming from Facebook, TripAdvisor, Google, and Instagram. The main goal of this analysis is to generate business insights to remove existing pitfalls in Customer Journey and consequently improve Customer Satisfaction and proactively manage the Customer Experience. I will work step-by-step using sandsiv+ to create insights and push the Enterprise Improvements into the organization.
In machine learning and natural language processing, a topic model is a type of model for discovering the abstract “topics” that occur in a collection of documents. Topic modeling is a frequently used text-mining tool for the discovery of hidden semantic structures in a text body.
At the other end, Text classification is the process of assigning tags or categories to text according to its content. It is one of the fundamental tasks in Natural Language Processing (NLP) with broad applications such as sentiment analysis, topic labelling, spam detection, and intent detection.
Unstructured data in the form of text is everywhere: emails, chats, web pages, social media, support tickets, survey responses, and more. Text can be an extremely rich source of information, but extracting insights from it can be hard and time-consuming due to its unstructured nature. Businesses are turning to text classification for structuring text in a fast and cost-efficient way to enhance decision-making and automate processes.
Assuming you have a Topic Modelling or Text Classification business problems to solve and you are not a Data Scientist able to code with Python or R, then it is quite difficult to find the right solution. At sandsiv+ we love to move the power of data analytics from data scientist hands to business people. Curious as to how it might be? Let’s have a look together.
It’s good to start with a plan, what we are going to do?
- Get the data
- Upload the data to sandsiv+
- Run an Exploratory Data Analysis
- Investigate the different topics
- Train a Convolutional Neural Network to automatically detect the topics (available in Part. 2)
- Extract insights in a dashboard to share with other colleagues within the Disneyland Paris organisation (Available in Part 2)
The aim of the whole process is to generate customer insights and push them into the organisation to improve Customer Experience.
1. Get the data
I’m going to use a public dataset available to anyone. You can find the dataset here. It is a French dataset containing 300K records coming from different sources: Facebook, TripAdvisor, Google, and Instagram. The dataset contains guest reviews related to Disneyland Paris. It includes comments in the time period between 2012 till September 29th 2017.
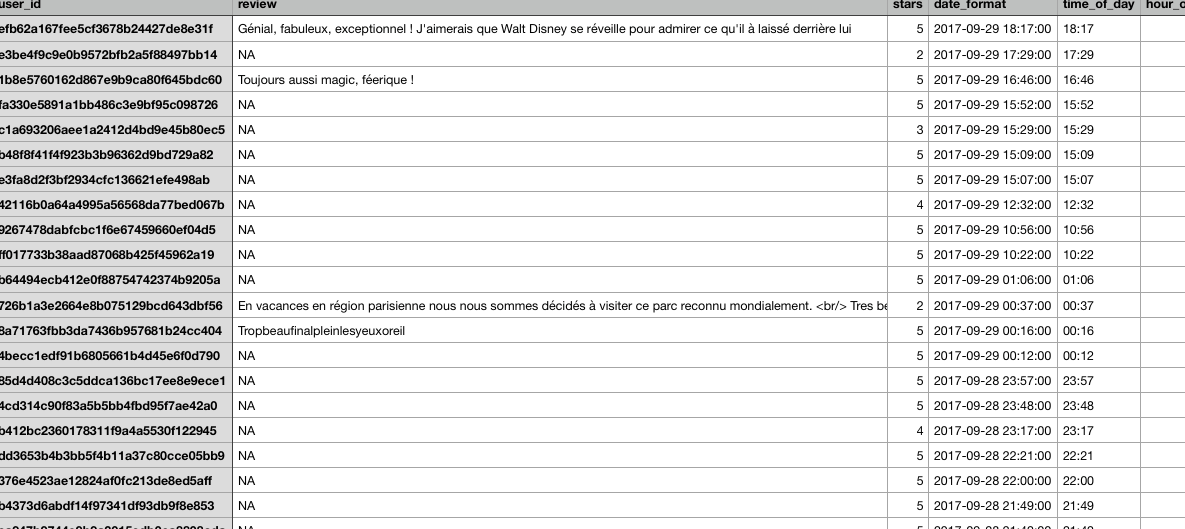
The file contains 299’635 records divided into 12 columns. I opened the file with Excel and realised two important things:
- the reviews are all collected in their original languages (approximately 57 different languages)
- a big portion of reviews is empty (N/A), there is the 5 stars rating but no comment
I removed the empty comment records and end up with 15’928 records. I automatically translated review in English using Google Sheet function GoogleTranslate
GOOGLETRANSLATE(text, [source_language, target_language])
creating a new column named “review_translated”. This new field contains the original review translated in English. Alternatively, I could mine each specific language in its native form. In that case I had to add a “detect language” column to the file, and instruct sandsiv+ to use that column to identify the original language.
2. Upload the data in sandsiv+
Once the Excel file is ready, we just need to upload it to sandsiv+ VOC STORE. VOC STORE is the app responsible to manage the Indirect Voice of the Customer. It is the engine to manage upload to the platform from standard XLS or CSV, to real time API data feeds from external websites (e.g. Yelp. Google, etc.) to internal applications (e.g. Salesforce, Microsoft Dynamics, etc.). Don’t worry, you don’t need to call your IT department, it is enough to upload the file using the sandsiv+ GUI.
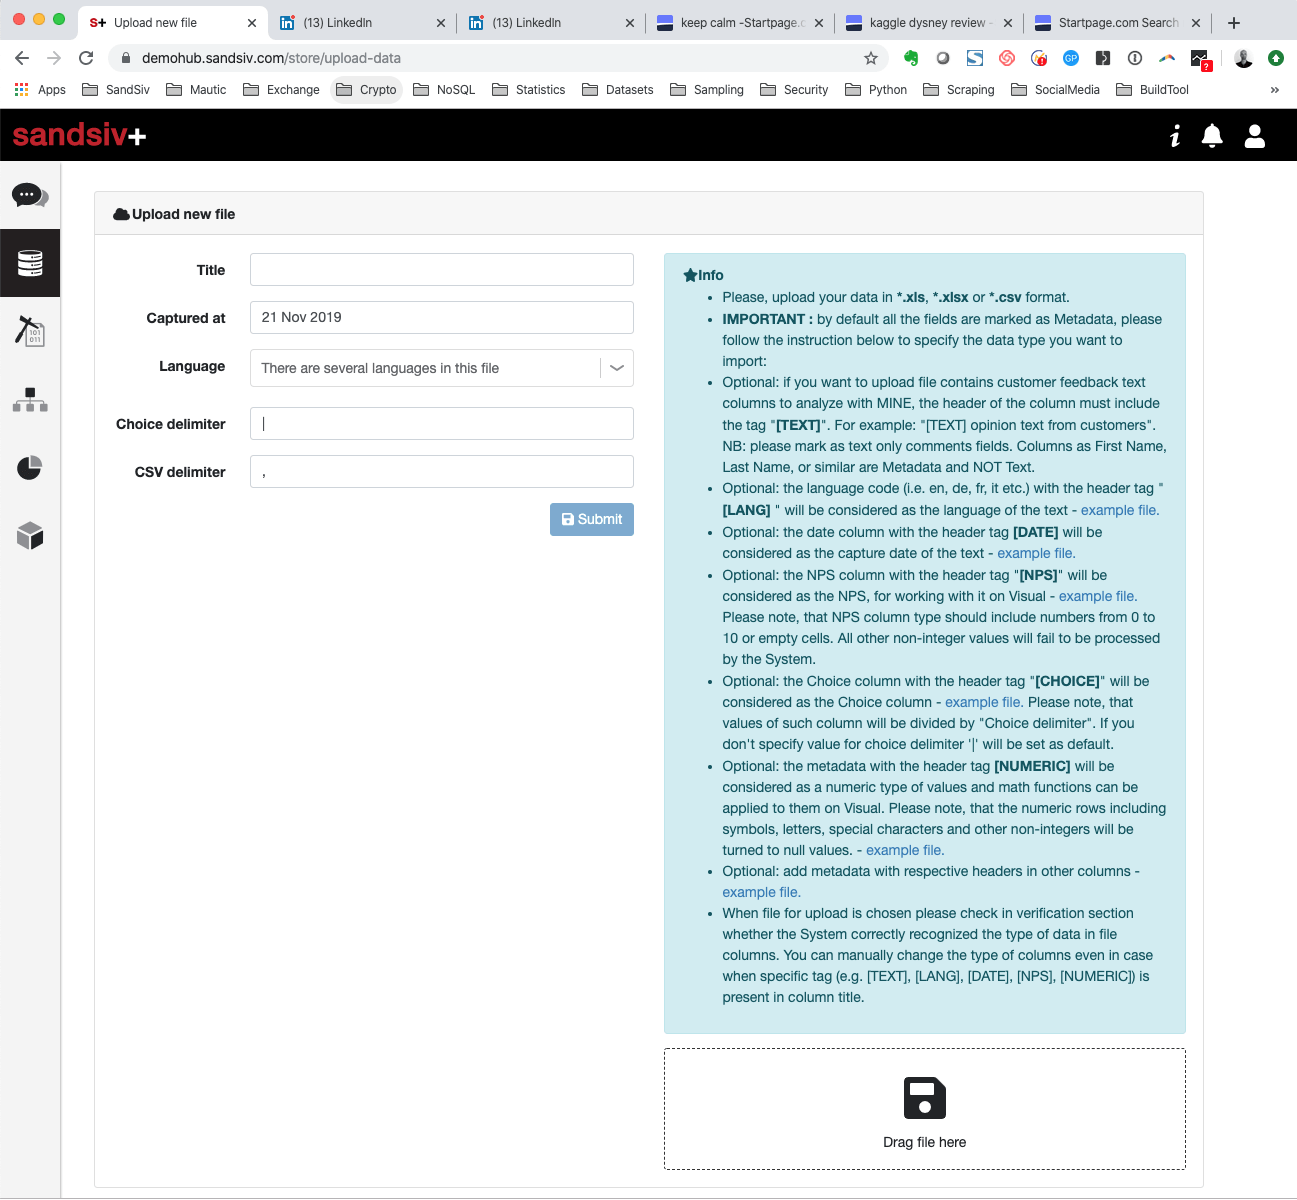
We just need to drag the file in the dedicated area, provide a couple of information, and the file will be automatically uploaded to the sandsiv+ MongoDB NoSQL data lake. Our proprietary ETL solution for Big Data will automatically perform specific tasks on the data. For instance, related to Natural Language Processing, text lowering, tokenization, part-of-speech, disambiguation, lemmatization, etc. (if you are not an expert NLP practitioner, don’t worry, we are simply running the magic to make the text understandable to the machines)
The system is providing valuable information once the file is uploaded:
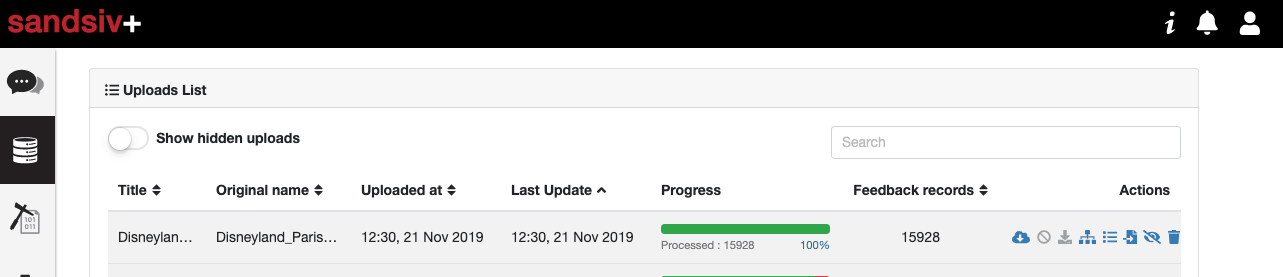
We can see all 15’928 records have been loaded and processed. We can, for instance, check the structure of the file. We can create new recalculated variables on the fly, we can recode variables, and, of course, we can link the information to existing datasets already available in the platform, or we can enrich data coming from surveys running in sandsiv+ VOC FEEDBACK.
Ok, the file is up and available for our further analysis. Let’s start with an Explanatory Data Analysis.
2. Exploratory Data Analysis
The clean dataset contains 10 variables for a total of 15’928 records. Let’s open sandsiv+ VOC VISUAL to explore the data. Here as follows a small extraction from the Exploratory Report.
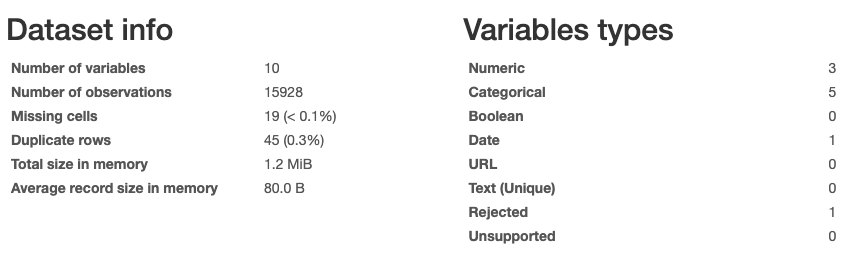
Evaluating the specific variables we can observe:
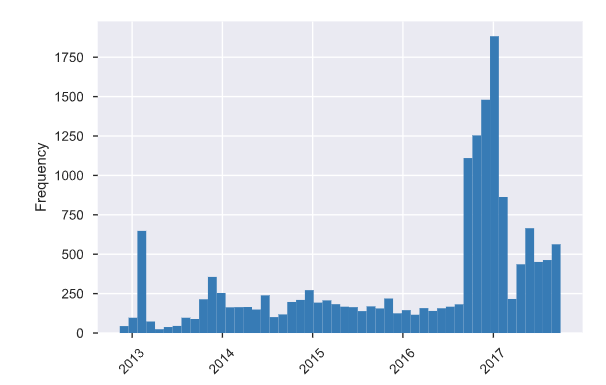
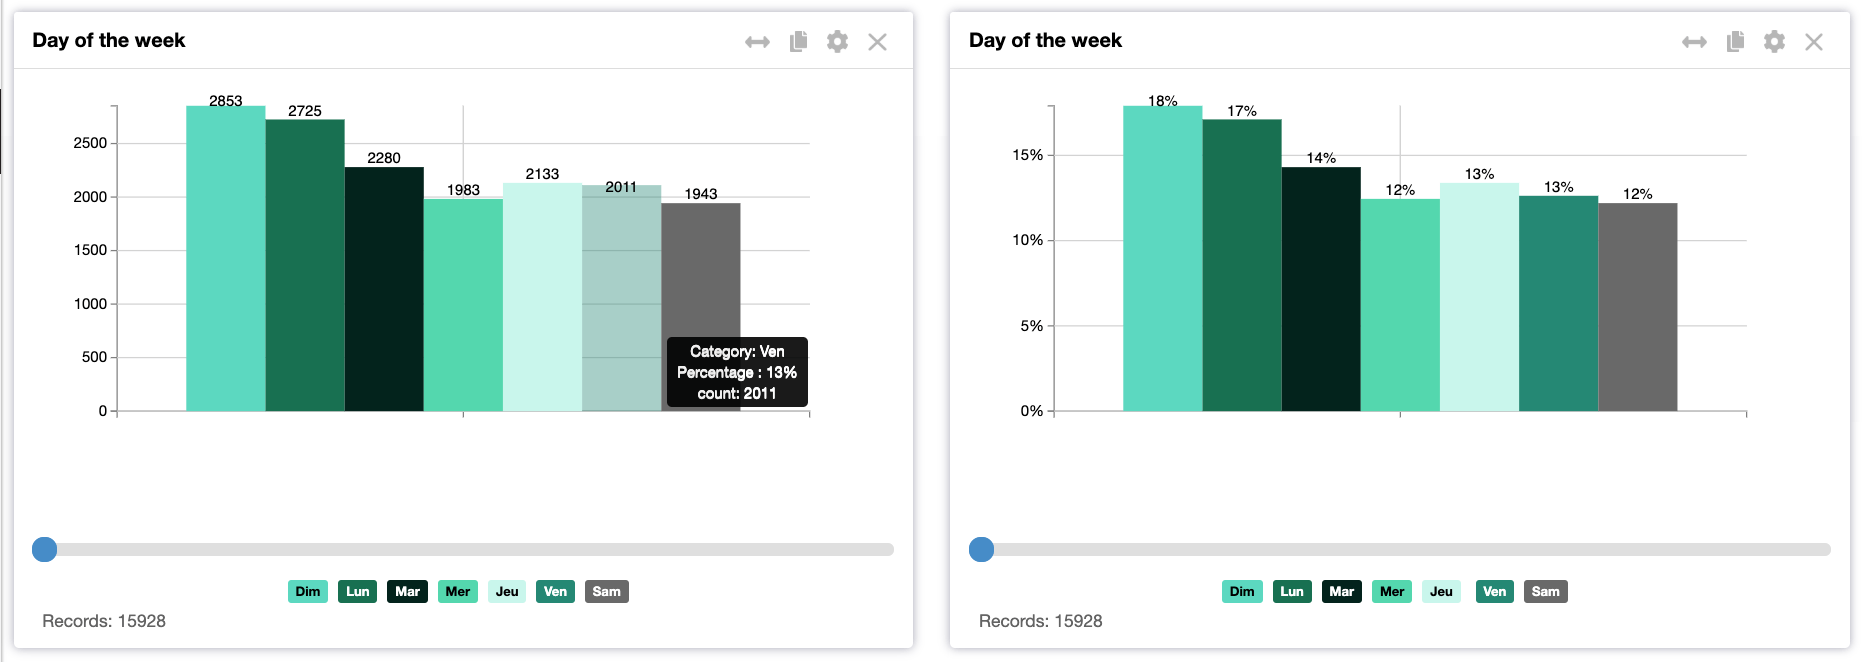
The majority of the reviews are in the year 2017, with the oldest on 11.11.2012 and the more recent on 29.9.2017. The distribution of the visit days shows Sunday and Monday have the two main days of the visit. However, all the other days are well represented as well.
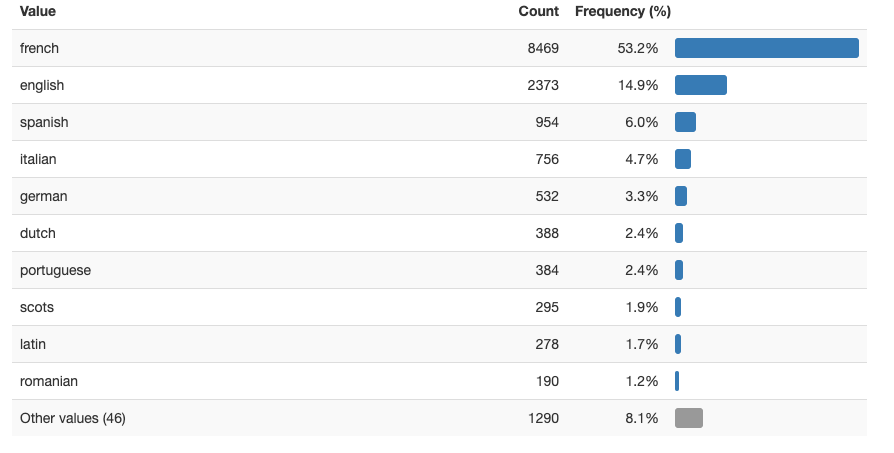
The file contains reviews in 57 different languages. The majority of them are in French (53.2%), English (14.9%), Spanish (6.0%), etc.
One of the most interesting fields available is the 5 stars evaluation of the Customer Experience (1 star = very bad experience and 5 stars = fantastic experience). With an average of 4.34, a median of 5, and a mode of 5 we can immediately note the dataset contains lot of positive reviews. We can definitely say Disneyland Paris delivers a very good Customer Experience and high Satisfaction to the Park’s visitors.
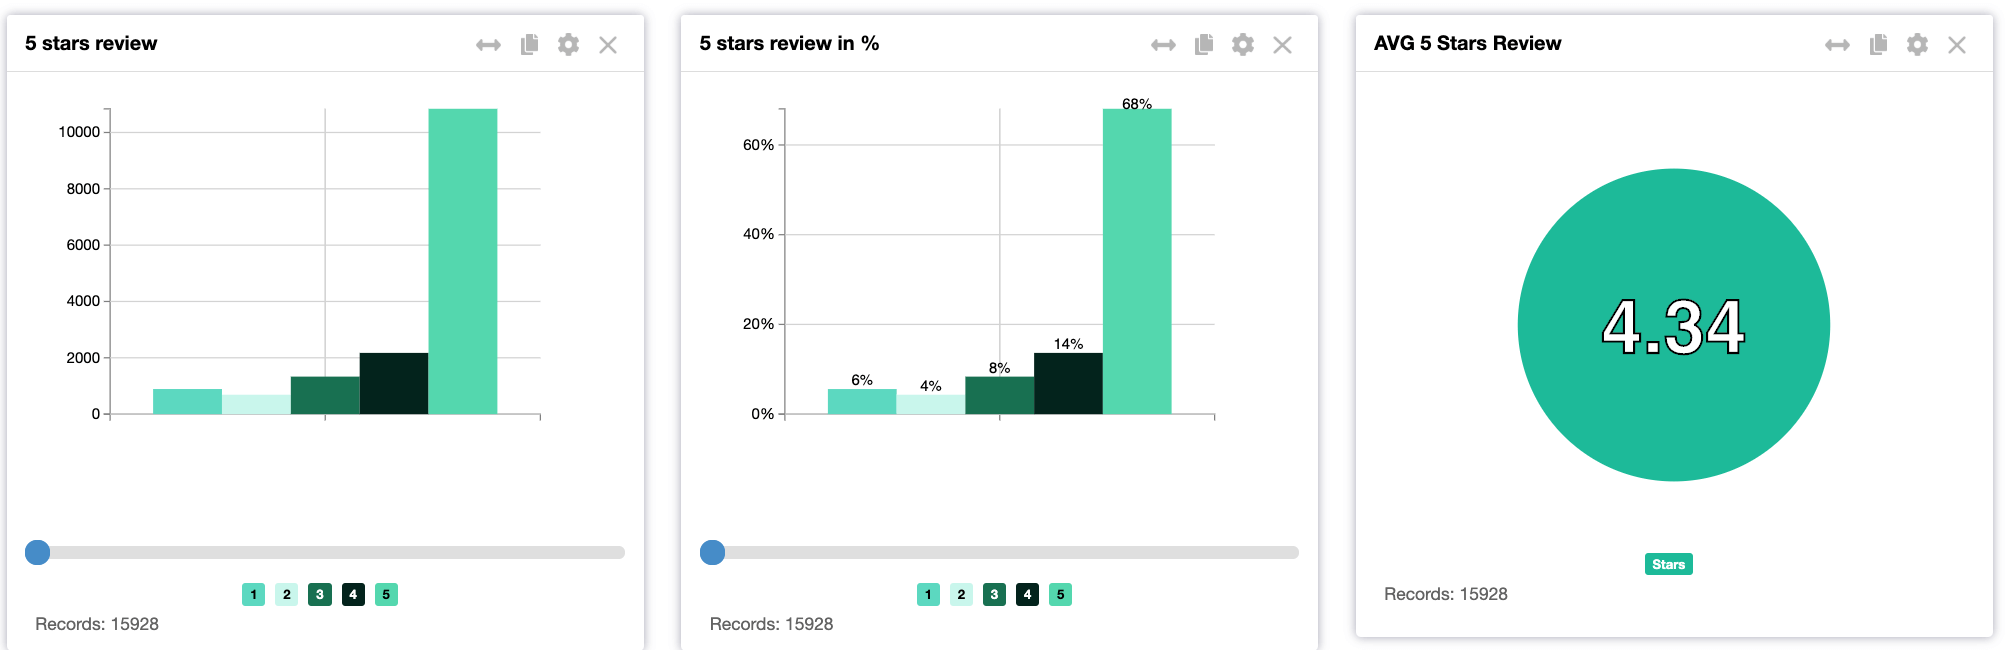
68% of the respondents gave a 5 stars review, only 6% gave just one star. It means we are analyzing a dataset where a small percent of respondents (10%) have provided negative feedback. It is a piece of important information when we will cross sentiment analysis and topic detection.
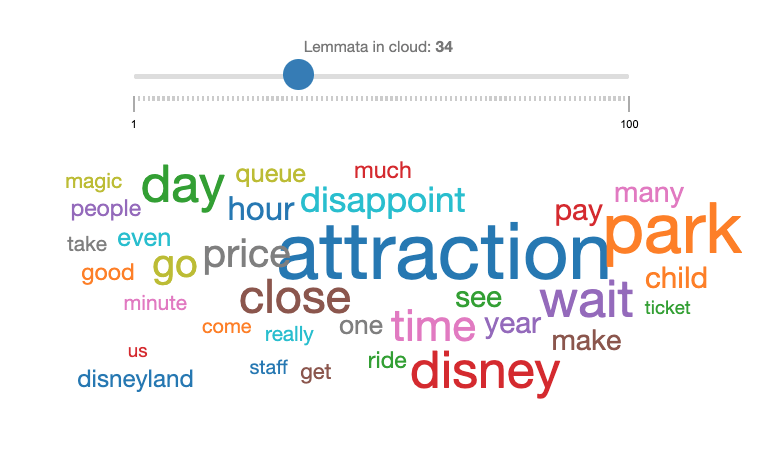
Let’s have a quick overview of the main topic contained in the reviews.
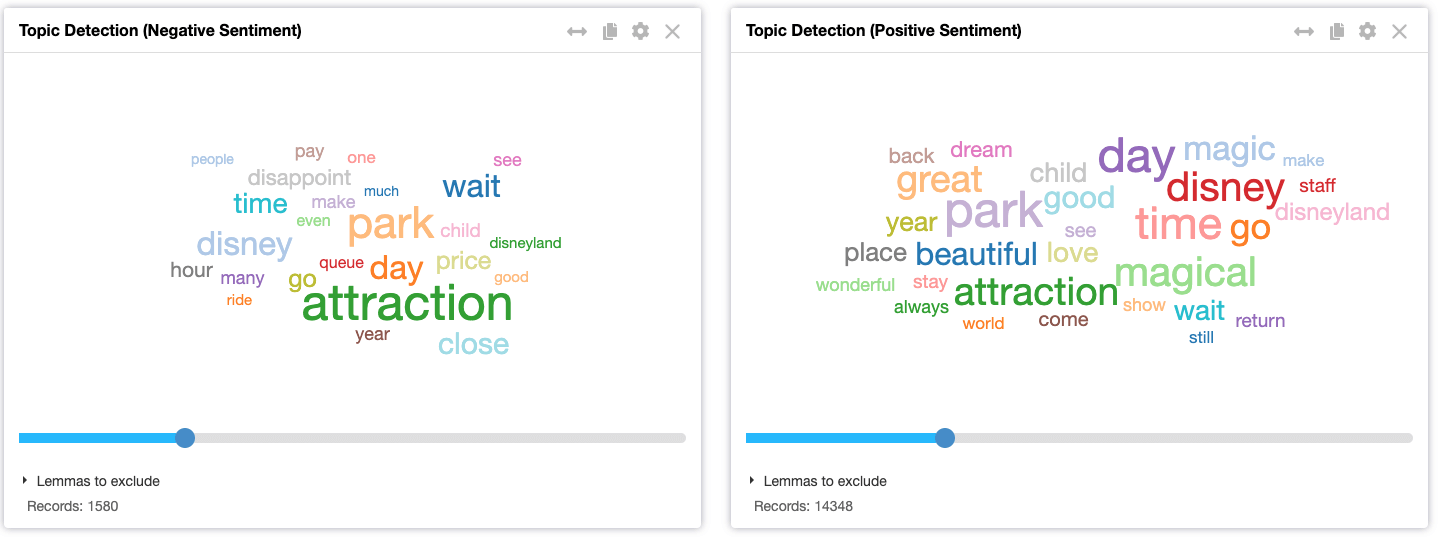
Well, we can see immediately some of the negative topics requiring further investigation: pay, price, time, queue. Important: those graphical visualisations are not word clouds, they shows already text passed through the first NLP text cleaning process. We will definitely deep dive into those topics later. The idea is to understand what are the drivers of dissatisfaction and provide those insights to the whole organization to improve the Customer Experience and potentially increase the already higher 4.34 average 5 stars score.
We want to understand the main drivers of dissatisfaction and implement change management to remove those traps from the Customer Journey. Let’s investigate different topics.
4. Investigate the different topics
We are going to approach the topic detection in two different ways. In the first phase, we are going to investigate the main relevant topics in the dataset. At the beginning we will not differentiate the topic based on the sentiment then, at a later stage, we will focus on the negative. In the second phase, we are going to focus on the hidden topics within the negative sentiment dataset. Those hidden topics are small in terms of magnitude but potentially dangerous for the reputation.
On a business point of view what we are trying to achieve is the following:
- Understand the main topics and the magnitude of those topics.
- Deep dive into the negative to understand the drivers of dissatisfaction, and quantify the magnitude.
- Discover “hidden topics” that are the moment are small in size (affecting few clients) but potentially dangerous in terms of reputation. These topics can also impact more clients in the next future.
- Once we will have those insights, we will be able to define an action plan to remove the pitfalls along the Customer Journey.
4.1 investigate the main relevant topics in the dataset
Let’s have a look at the main topics in the dataset. We are going to open the dataset we uploaded before using VOC MINE of sandsiv+. VOC MINE is the supervised Text Mining solution made from business people for business people. The results of the dataset analysis are then immediately available in an easy to use graphic user interface made for business people. You don’t need to be an experienced data scientist to use the tool. See the screenshot below:
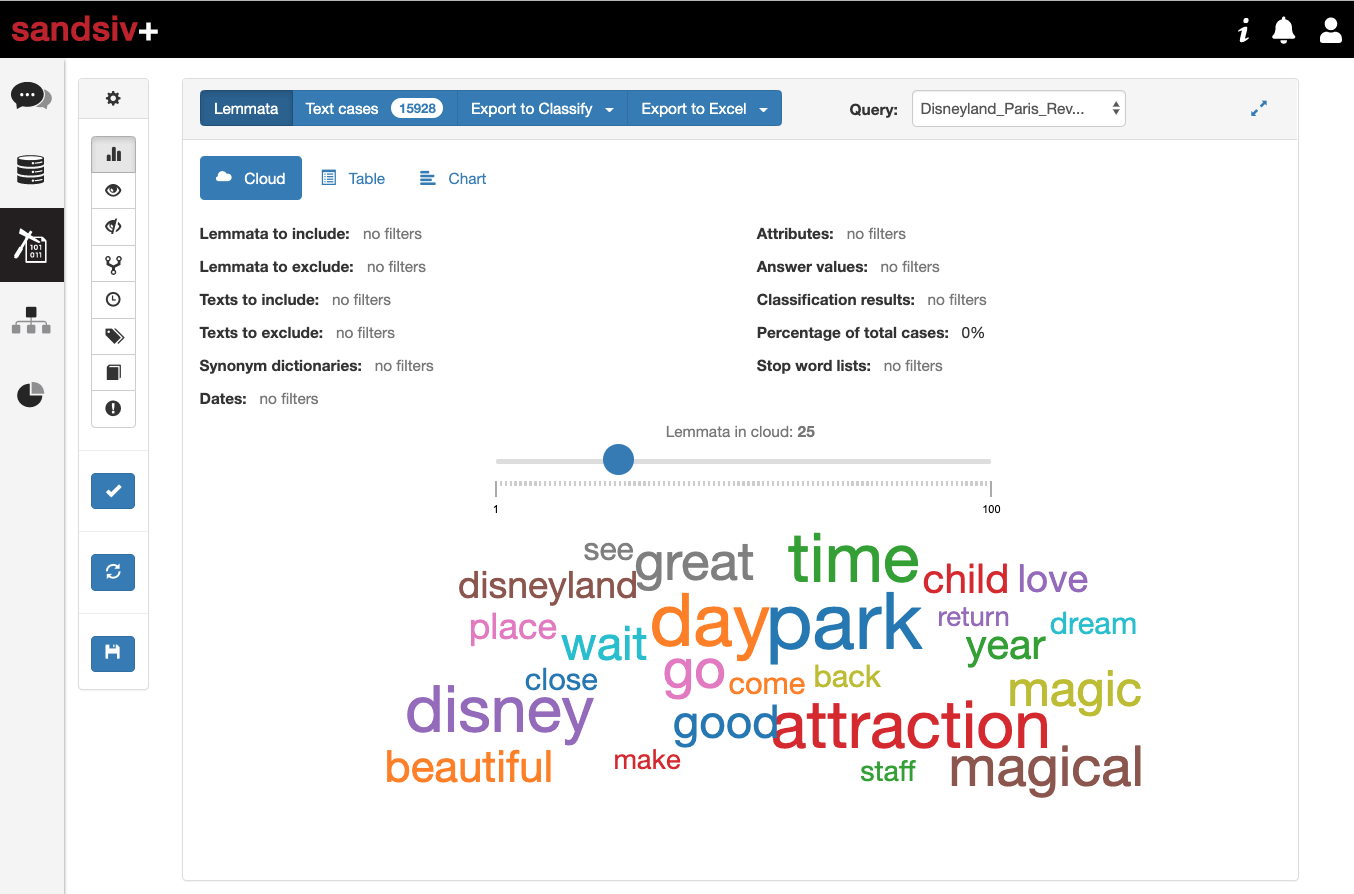
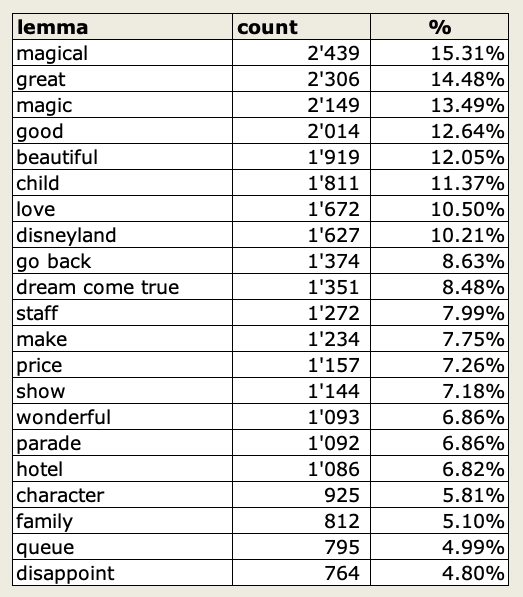
Well, we are definitely in front of an extreme positive sentiment file. We recognise already a lot of positive topics, not useful if we want to improve the Customer Experience. Let’s have a look at the figures. I can visualize the results of the lemmatisation in a horizontal bar-chart view, and I can also download the results of that analysis in Excel. Let’s have a quick look at the most mentioned topics:
In order to focus on improvements, we will deep dive the negative only. For that reason, we will apply a filter to our dataset, including just the star 1 and star 2 rating. Of course in sandsiv+ is possible to apply a sentiment model and score all the feedback, but in such unbalanced dataset, it is clear the 1 and 2 stars rating are really negative reviews.
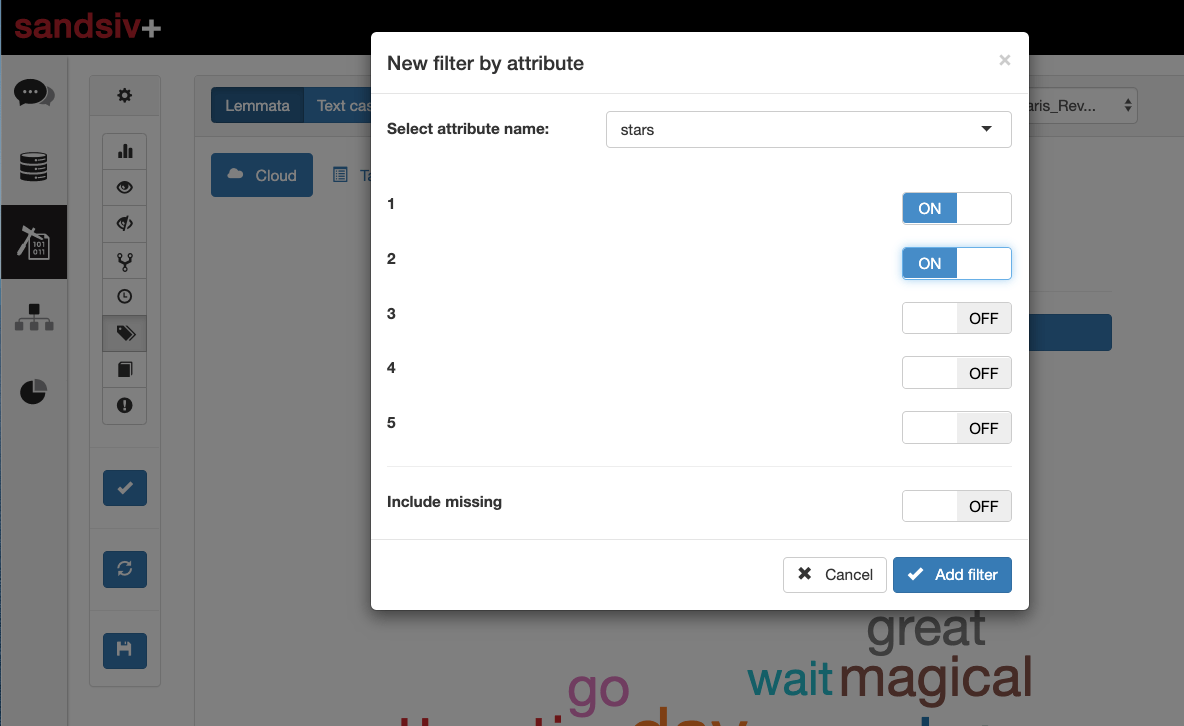
Of course in sandsiv+ it is possible to create and apply a sentiment model to extend the analysis to negative sentiment with 3, 4 and 5 stars, but it is out of the scope of this post.
Once the filter is applied, we are going to mine just the negative reviews. We do this because we want to focus primarily on the topics able to generate insights we can then turn into operational improvements. We want really to focus on the drivers of Customer Experience and remove pitfalls from the Customer Journey.
The quick high level view of the negative topics includes:
- Waiting Time (436 reviews)
- Attractions closed (401 reviews)
- Price vs. closed attractions (335 reviews)
And of course we can go further to all the other topics. In any case, we have here already 3 specific topics where the CX Team can work on building the business cases in order to start some specific project to remove those pitfalls from the Customer Journey. Let’s have a look at the hidden topics. The topics that are less visible but not for that reason less important to find and manage.
4.2 Discover hidden topics
Once again, let’s focus on the NEGATIVE (star 1 and star 2) reviews. Our aim is to understand negative drivers affecting the Customer Experience. The first thing we will do is to have a total unsupervised look at the data. We won’t influence the machine, but we let the algorithm work alone to discover the association between topics and start to identify precise topics we will then investigate further using a more supervised approach.
We run two specific analyses within sandsiv+, a co-occurrence and a correlation between topics. In a few words, sandsiv+ will execute two specific tasks:
- Check the occurrence of consecutive words. Technically they are called n-grams, and the system checks the existence of potential consecutive words and counts them.
- Check the existence of specific pairs of words within the same document (review) and count them creating a correlation.
Let’s have a first look at co-occurrence. It can be easily done in a nice graphic way directly in sandsiv+. Have a look at the picture below. Check the existence of specific pairs of words within the same document (review) and count them creating a correlation.
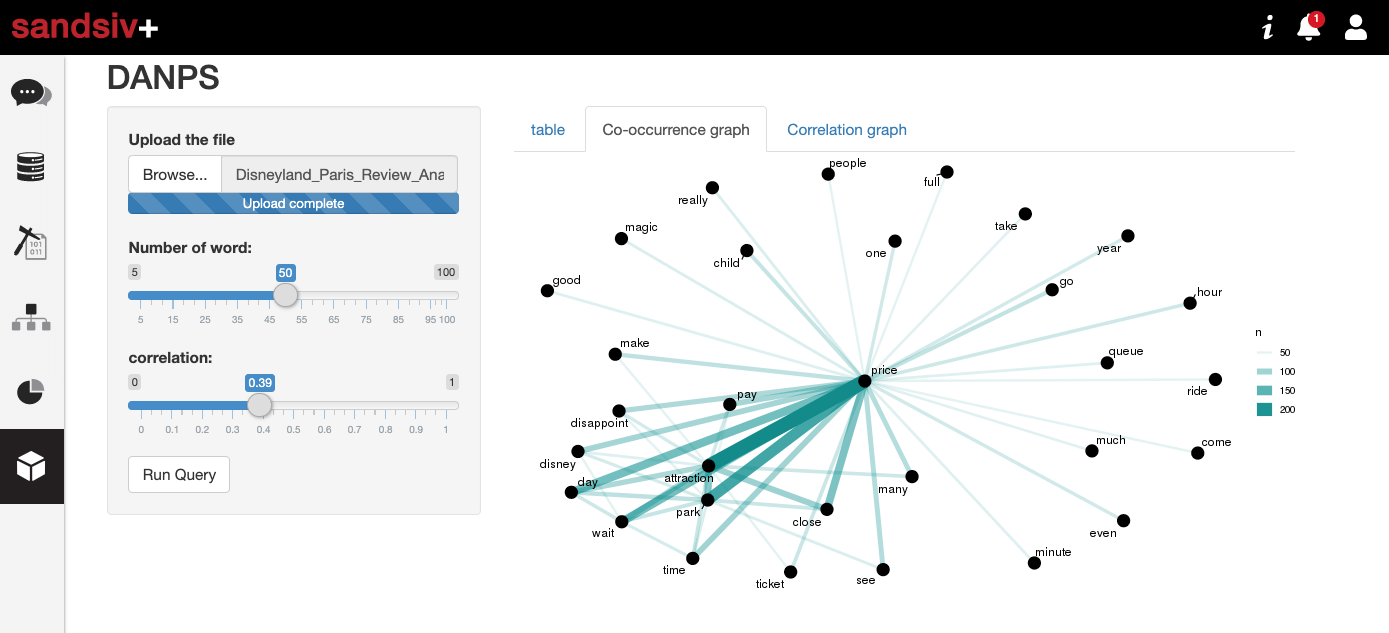
The co-occurrence chart gives already some good indications about the insights we can find in the dataset. Some initial insights related to the co-occurrence analysis bring us the following result:
- Price is one important topic in relation with many attractions closed
- Waiting time
- Queue is another topic
To go even deeper in our analysis let’s run a correlation analysis among the topics. It works with a similar interface. We are going to plot the network of the topics and modify the strength of the correlation with the slider to visually check potential association between topics. Remember we are just considering reviews with 1 and 2 stars only.
Playing with the ruler and adjusting the correlation, we come to a good and readable interpretation of the data at 0.22 level. Let’s have a deep look and try to identify potential topics.
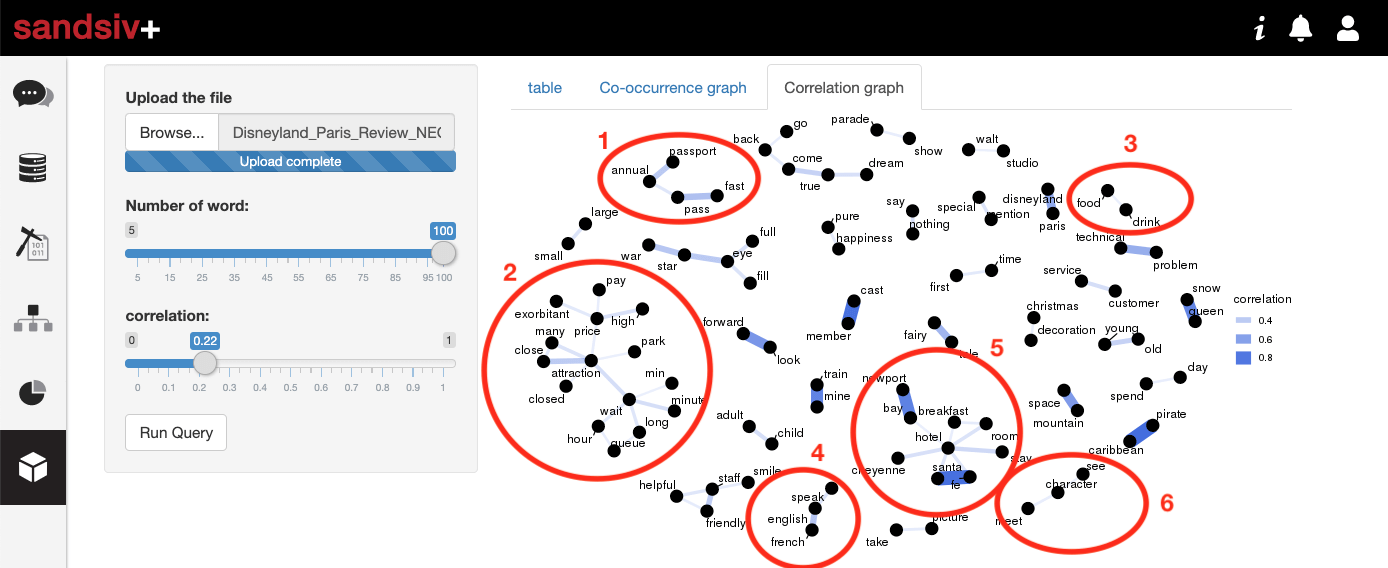
- Topic #1 is related to the “Annual Passport” and to the “Fast Pass”
- Topic #2 is probably related to the “Exorbitant price to pay”, the fact “Many attractions are closed” and “There are long queue and long waiting time to access the attractions”
- Topic #3 requires further investigation and it is related to “Food & Drink”
- Topic #4 is again something we must explore deeper, it is related to the languages, and especially to “English and French”. Remember, we are in Europe, specifically in France. French people are really sensible to foreign languages.
- A further investigation is required to Topic #5. Something is reported in relation to the hospitality and in particular to breakfast.
- Topic #6 is related to “Meet and see characters”
As you can see, in a few minutes and without a particular effort, we have already identified 6 potential hidden issues related to our Customer Journey. We need to further investigate on those specific topics. We will do it performing a supervised analysis using sandsiv+ VOC MINE, the tool we already used before. It is a supervised Text Mining tool created to easily allow business people to deep dive in unstructured data.
VOC MINE allows us to deep dive in the different topics, and understand, among others, two specific insights:
- Does the topic really exist in the dataset? Is it something the client are talking about?
- Can we quantify the topic in a way we can create a valid business case to start a change management process?
In the video we quickly investigate the WAITING TIME topic associated with the topic #2 we listed before during the total unsupervised approach topic detection. Let’s have a look some of the topics getting the two specific insights mentioned just above.
TOPIC #1
We assume that the topic is related to two sub topics: “Annual Passport” and to the “Fast Pass”. Let’s have a look at the first one.
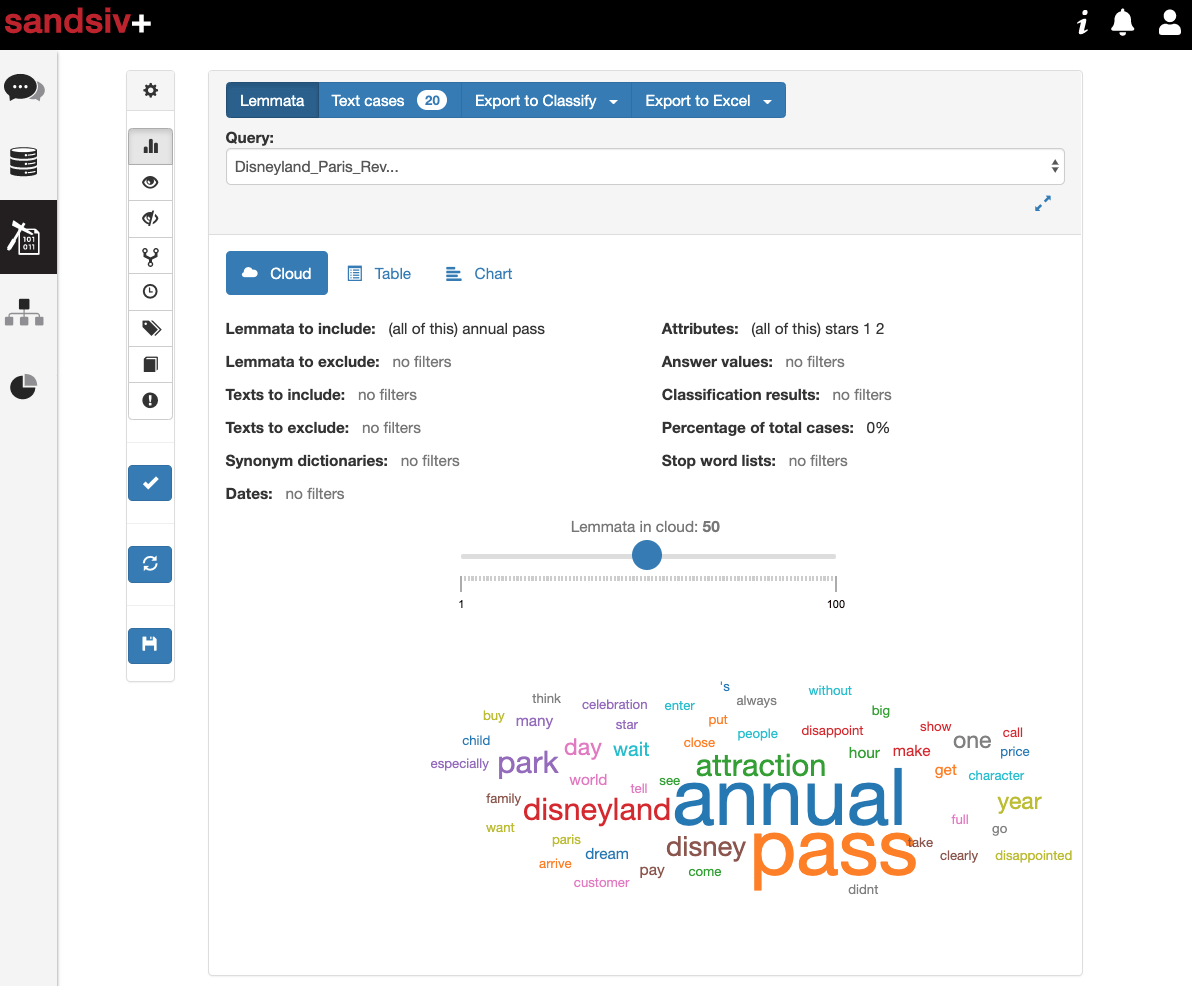
Let’s see some example of the reviews extracted by sandsiv+:
“always so disappointed to pay an annual pass for as many attractions closed on hand to talk about here to there without action on your part it will surely asterisk that we will host the next year”
Let’s pick some other examples:
“no sick sucks attractions still out sick to be evacuated attractions after hours of tail tired of disgusting toilets I do not renew my annual pass”
“As I remain a fan of the park so I’m totally disappointed in your waiting customers day service for a terse response to a request for assistance for the purchase of annual passes including renewals all that to tell me to go through a toll number made internships with uber d d airbnb to understand what customer experience means”
Well, despite the number of customers associated with topic ANNUAL PASS is low, they are all really questioning about the price/performance of that product. It is often associated to the fact client doesn’t want to renew it (churn). It is a topic that has a clear financial impact.
Let’s check the second sub-topic “Fast Pass” where we can clearly see some associations.
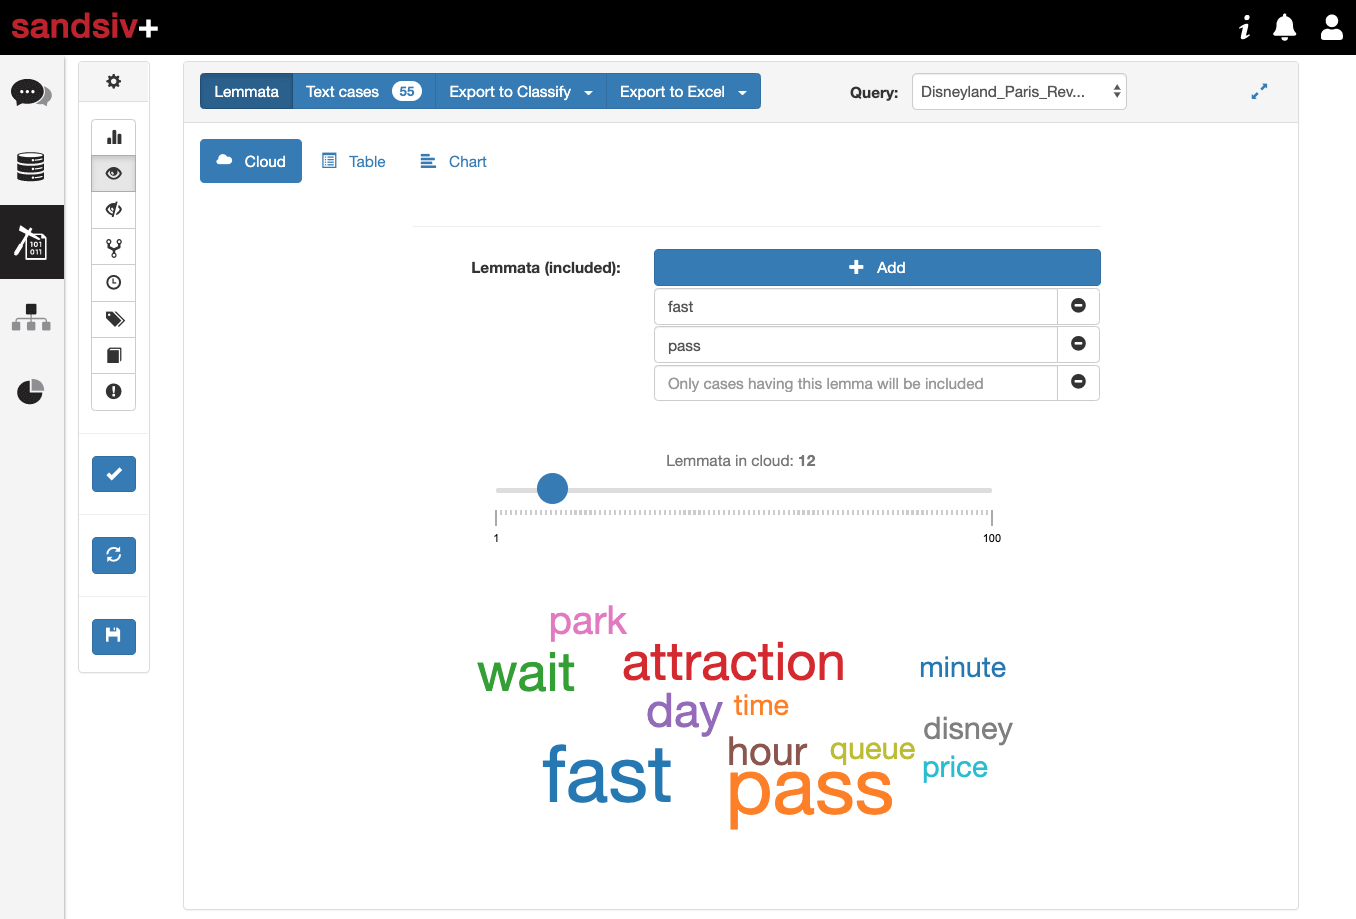
I would say that WAIT, TIME, and QUEUE are really sub-topic giving a feeling of something wrong with the “Fast Pass”. We are considering here a total of 55 customers, but those unsatisfied customers can impact revenues and are spreading negative word of mouth in the social media. Let’s have a look at some of the reviews.
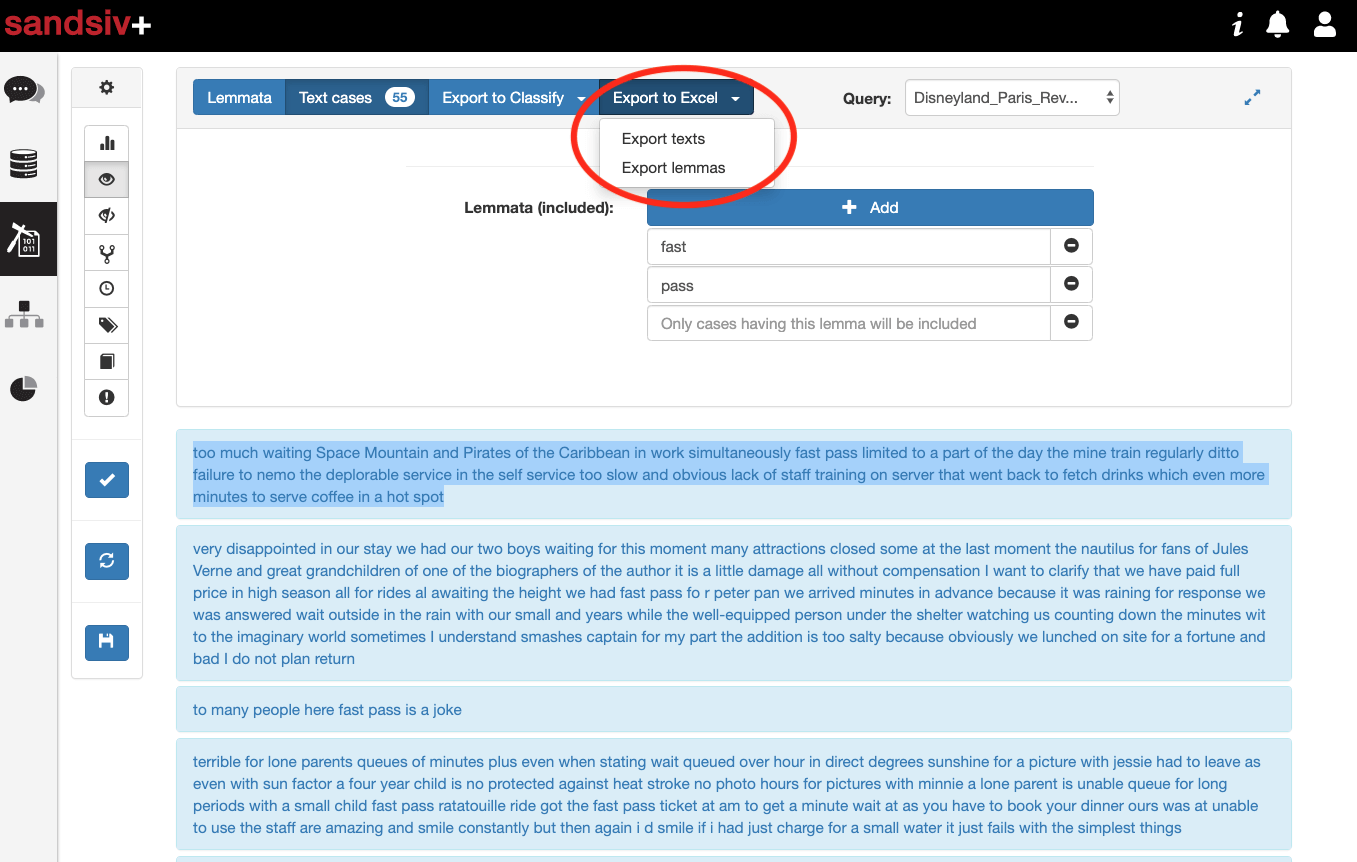
“Too much waiting! Space Mountain and Pirates of the Caribbean in work simultaneously. Fast pass limited to a part of the day the mine train regularly ditto failure to nemo the deplorable service in the self service too slow and obvious lack of staff training on server that went back to fetch drinks which even more minutes to serve coffee in a hot spot”
I have now the possibility, for example, to export those reviews in excel and share with people in the organisation responsible for the product management of Fast Pass product and experience.
Of course I would do the same procedure for the other 5 TOPICS. I don’t do it now because I personally think is a little bit time consuming and I already demonstrated the power of the tool extracting hidden topics. Anyway, I’m really curious about digging in two specific HIDDEN TOPICS “Food & Drink” and “Breakfast”. Let’s check the two.
“Food & Drink” are complains related to restaurant in the Park. Let’s check quickly what topics are associated with “Food & Drink”.
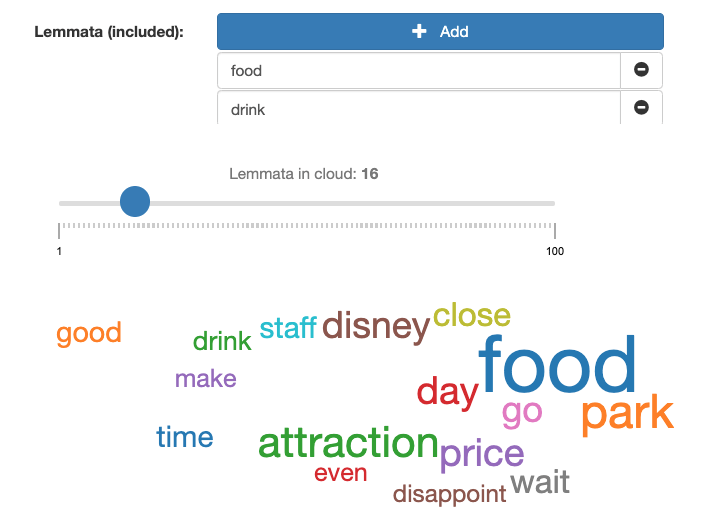
We can deep dive in PRICE and everything associated with DISAPPOINT. Let’s filter them and check some example.
“Your food restaurants are a joke there is no place open to buy food before and when they are open you have one operator on the till while the queues get bigger and bigger i’m absolutely disgusted with the service you provide you would never encounter this in disneyworld florida”
“I went to the chef Remy from ratatouille restaurant it took hours total at the restaurant food was cold very bad service to expensive for that experience”
When we deep dive in BREAKFAST we can see the main issue is related to the waiting time.
“We went to spend New Year and both parks and hotels were a Kaos authentic queues endless attractions that were outside after service queues of over an hour and a half queuing up for breakfast”
Conclusions Part 1
What we have done so far is to discover the main topics associated with the negative sentiment. In a very short time, analysing data, we were able to discover 6 main areas of topics where we can start specific change management projects to improve the experience of Disneyland Paris customers. To summarize:
- We uploaded a dataset of Disneyland Paris reviews to sandsiv+
- We start analyzing the 15K reviews and find the bigger topics mentioned by customers
- We filtered the dataset including just the 1 and 2 stars reviews assuming them as negative reviews
- We analyze them using a supervised approach
- We analyze them, once again using a full unsupervised approach
In less than 60 minutes, without a previous knowledge of the industry and the specific Park operations, we provided already a list of valuable insights to be consider to remove pitfalls from Customer Journey and deliver a better Customer Experience. Here is the list of topics we quickly discovered:
- Waiting time at the attractions and at restaurants.
- Attractions closed vs. price: why Disneyland Paris doesn’t reduce entrance fee when attractions are closed?
- Annual Passport not providing the expected value: churn risk.
- Fast past doesn’t work as expected, in certain particular time of the day is not usable.
- Problem with long line getting food at restaurants.
- Quality of food, or food cold.
- Long queue for breakfast at hotel restaurants
I also deep dive in the French/English topic and I try to elaborate it in the best political correct way avoiding yet another Anglo-French war:
- French people complains lot of signs in the Park are in English, but the Park is in France.
- English people complains because staff is not able to properly help guests in English.
You got so far a quick limited overview of what sandsiv+ can provide to an organization such Disneyland Paris to improve Customer Experience.
Now, imagine to do the same with your own data. Would you like to get a quick demo using your dataset? Book a demo.