Put your customers at the heart of your business improvements
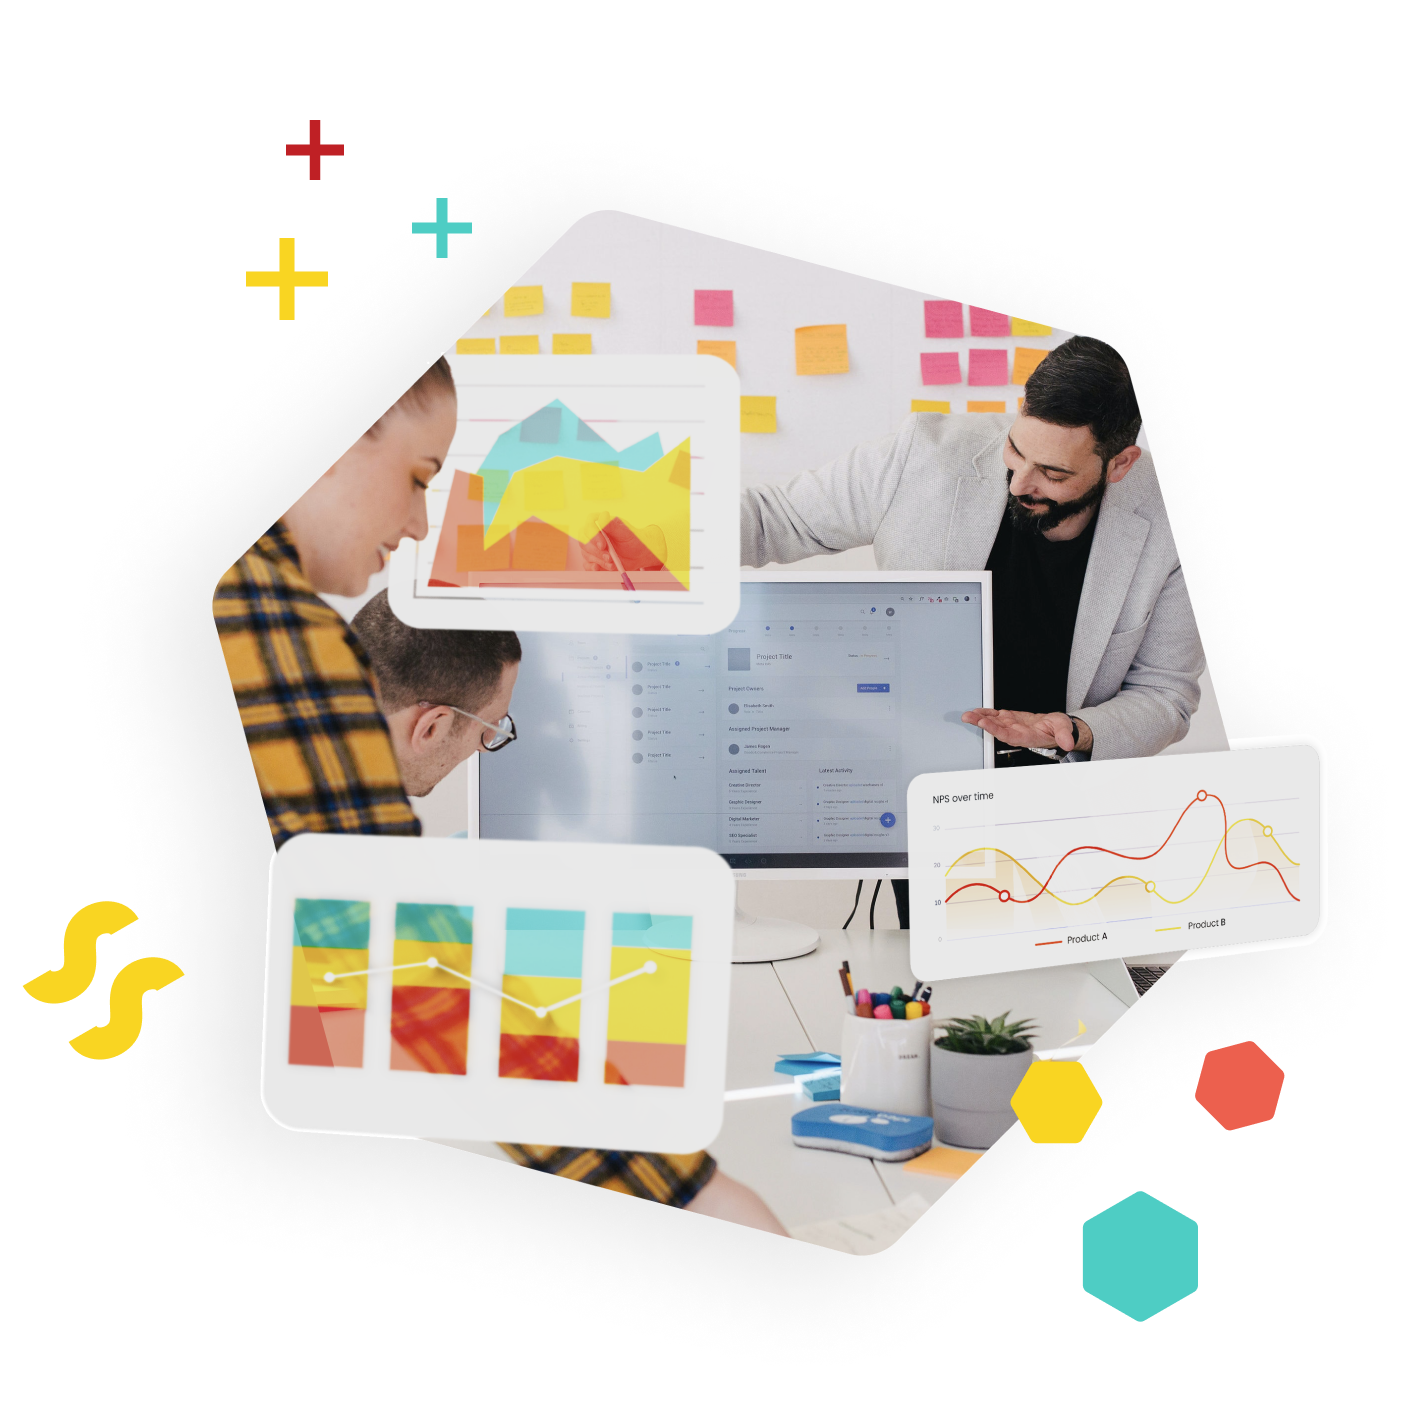
Implement an advanced dashboarding system to fully understand your customers, enabling both strategic and tactical decision making and creating tangible business improvements.
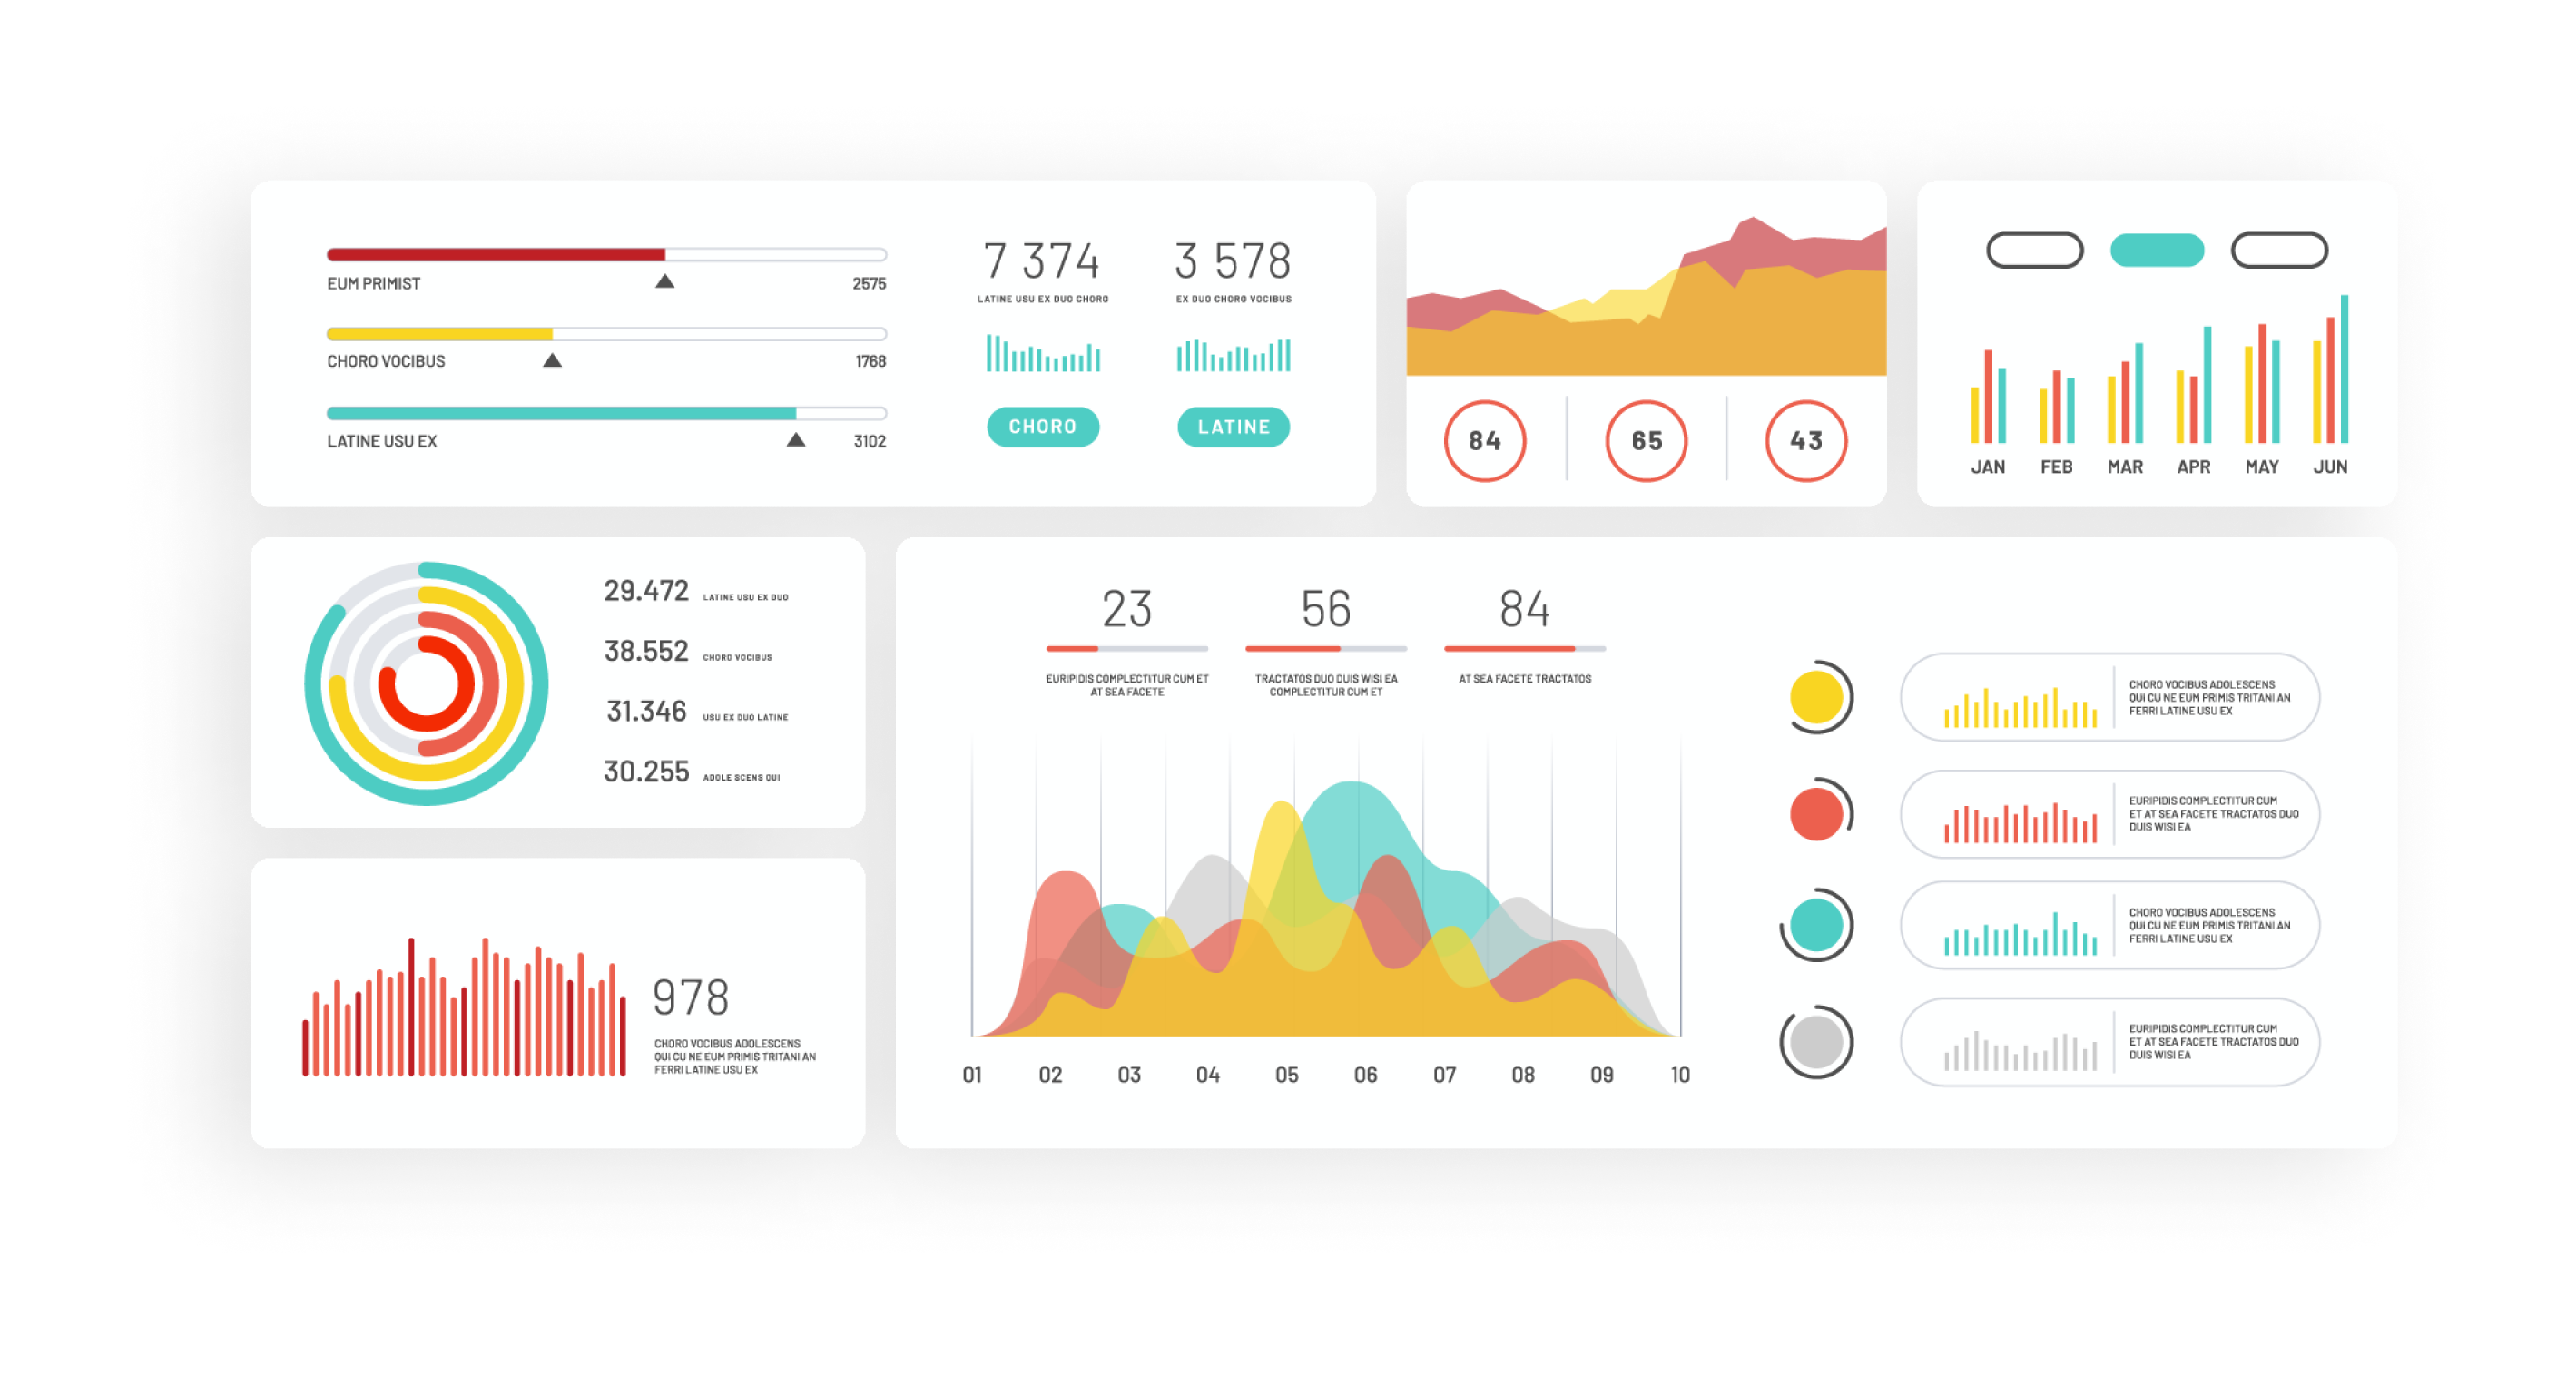
Use visualization, interactive controls, markdown, drill-down and other features to produce customized dashboards. Allow all your employees to switch between multiple charts and functions to develop appropriate analysis.
Key features
Interactive charts
Drag and drop fields, dynamically zoom in and out of certain subsets of data, and see immediate previews as your data takes shape.
Threshold-based alerts
Create and edit alerts based on thresholds and send emails or notifications on Slack.
Canvas
Infuse your brand and style into your data history with logos, colors, and design elements that are unique to you.
Brilliantly secure
Advanced user access and controls to invite your team members into certain spaces and not others, giving them access to specific content and features.
Powerful UI
Many visualization panels ready for live expression of your data: area, stacked area, bar, stacked bar, line, cake, donut, treemap.
Opportunity detection
The machine learning feature of sandsiv+ advanced visualization tool helps you detect anomalies, even those hidden in your data.
#1 European Voice of the Customer solution

A deep-dive on sandsiv+
Start growing with sandsiv+ today


