If you have not read my previous article, I suggest you do so. It will allow you to understand the business benefits you can create with predictive models before you understand exactly how the models themselves are created. Enjoy your reading!
Want to know how to beat the downward spiral of survey response rates and accurately calculate ROI in real time? Look no further than sandsiv+! In a recent article, I delved into how this powerful platform can transform your customer experience measurement with its cutting-edge predictive AI models. And don’t worry; you don’t need to be a data analysis whiz to make the most of these models. In this post, I’ll simplify the process in plain language so that even business people can easily create effective models.
Let’s dive in with the dataset we explored in my previous article – a data collection from 10,000 customers, with 3,000 responding to the NPS survey and 7,000 remaining silent. Thanks to the sandsiv+ platform’s advanced capabilities, we can create and run predictive models in real-time to gain insights into the behavior of those who don’t participate in surveys. By identifying at-risk customers, potential cross-sell and up-sell targets, and more, this Voice of the Customer solution becomes a crucial component of your tech ecosystem. Plus, with instant monetization of results, you’ll have everything you need – as discussed in the last article – to accurately calculate your return on investment.
Here is how the following narrative will unfold:
1. The dataset
2. Run the survey
3. Let’s build the models
4. Training time – Model building and comparison
5. Predictions and Model Evaluation
6. Conclusions and Final Thoughts
1. THE DATASET
Let’s look at the dataset we’ll be using – it belongs to a bank, though I can’t reveal their name for confidentiality reasons. The process is straightforward: when I upload the data to request customer feedback, I’ll include metadata for all 10,000 customers that will later aid in building our predictive models.
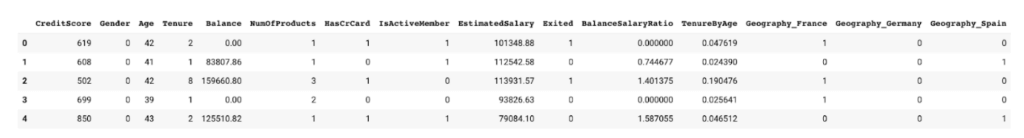
So, how did we choose which metadata to include? We focused on behavioral data, which tends to be the most informative when building these models. This means we’ll be starting with variables such as:
- CustomerID (a unique identifier for each customer)
- CreditScore
- Geography (the customer’s country of residence)
- Gender
- Age
- Tenure (how long the customer has been with the bank)
- Balance (the account balance at the time of the survey)
- NumOfProducts (the number of products in their portfolio)
- HasCrCard (whether or not the customer holds a credit card)
- EstimatedSalary (their estimated salary)
- 1st_CLV (the customer’s lifetime value at the time of the survey invitation)
The number of variables may be relatively small, but they are considered discerning and indicative of the customer profile. A survey will be disseminated to all 10,000 customers to gather enough responses to define the target variables, which are the variables of interest for prediction purposes, such as whether a customer is a possible detractor.
The Customer Lifetime Value (CLTV) is not a typical variable, as it is calculated through a distinct process that occurs weekly and is governed by specific guidelines expounded in further detail within this paper.
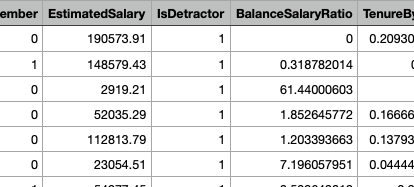
Moreover, additional variables shall be incorporated into the analysis by utilizing derived variables such as the BalanceSalaryRatio, obtained by simply dividing the balance by the estimated salary, and the TenureByAge, derived from dividing the tenure by the customer’s age.
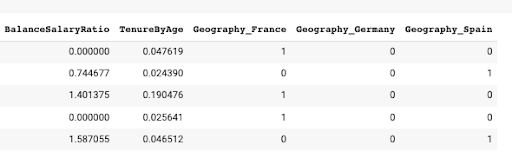
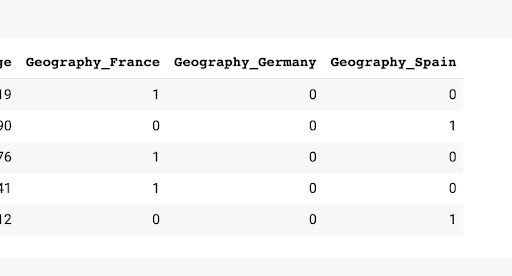
At this juncture, we’ll execute an operation on specific variables that facilitates the conversion of categorical variables (such as Geography) into numerical variables. This operation is required because neural networks can only process numerical data, rendering information such as Spain, France, or Switzerland redundant. As a result, the Geography variable will be transformed into n columns, each representing one of the countries contained within the variable. For instance, Geography_Spain will have a 1 or 0, indicating its veracity. The sandsiv+ platform will perform this operation automatically for your convenience.
The rationale for this procedure is that neural networks demand numerical values rather than textual data. Therefore, the transformation of these variables will generate values compatible with the neural network architecture. Please note below are examples of the derived columns:
2. RUN THE SURVEY
At this juncture, we’ll start the usual procedure of asking for feedback. In the present context, we would like to invite 10,000 customers, from whom only a fraction are expected to respond to the survey. Upon collating the data, the resultant dataset will be augmented with multiple new columns, encompassing the respondents’ Net Promoter Score (NPS) evaluation. This shall enable us to gather insights from customers who rated the service on a scale of 0 to 10.
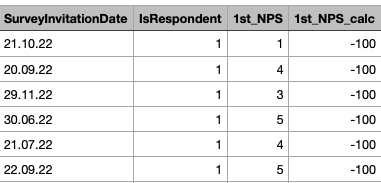
We will automatically set the sandsiv+ platform from this variable to generate two new columns: IsDetractor and IsPromoter. Both columns will contain a boolean value of 0 and 1 for false or true.
The two columns in question shall serve as the target variables for our models. Our models aim to predict whether a customer who has not responded to the survey is potentially a DETRACTOR or a PROMOTER. Subsequently, the sandsiv+ platform will interface with the usual suspects, such as Salesforce, MS Dynamics, and other CRM or Marketing Automation tools, to initiate specific actions on these customers. These actions may involve win-back strategies, churn avoidance, up- and cross-selling endeavors.
3. LET’S BUILD THE MODEL
It’s been a straightforward process thus far. If you’re acquainted with the sandsiv+ platform, you may have noticed that we haven’t deviated from our usual approach, except for generating two RECODE VARIABLES that we’ll require to construct the actual models.
Next, we navigate to the MACHINE LEARNING segment of the platform and utilize convenient wizards to build the models.
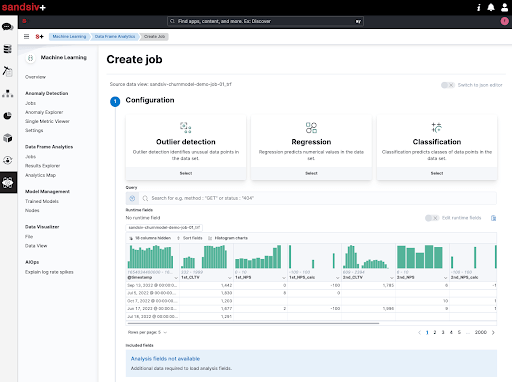
As you can see at figure 6, I can easily construct models for Outlier Detection, Regression, and Classification in an intuitive manner. As we aim to generate a model that can categorize records into two separate classifications, we will choose Classification. Additionally, the GUI provides the convenience of accessing and viewing all data distribution statistics right away.
The process of building the model will involve five steps:
- Configuration
- Additional Options
- Job Details
- Validation
- Create
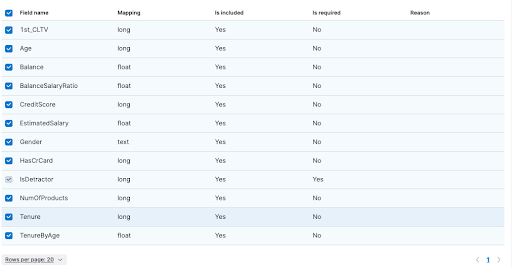
In the first step of the creation process, we must immediately specify our dependent variable, which is the target variable that we want to predict. In our case, we want to create a model that can identify whether a customer is a Detractor or not, so we will select the “ISDetractor” column. (Figure 7)

The system defaults to selecting a number of independent variables that will be employed to prognosticate the dependent variable. (Figure 7) However, the user retains the prerogative to select the variables they deem most pertinent to input into the model. In my specific scenario, I have opted to select a collection of eleven variables that I regard as particularly salient for the purpose of modelling the problem at hand.
The ability to visually check the strength of correlation between variables is interesting. The Graphic User Interface allows at a glance to see which variables might have the most predictive power. (Figure 9)
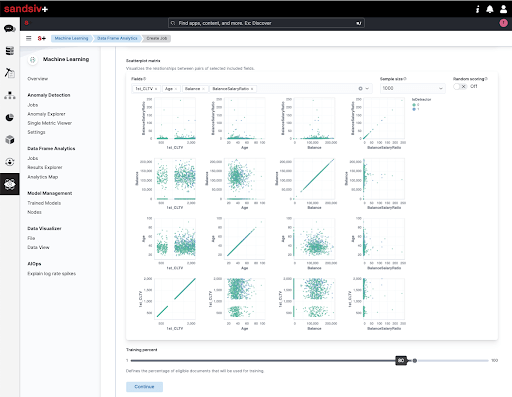
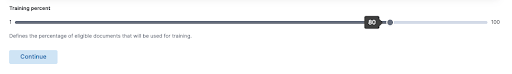
In the configuration section you can also select the portion of the dataset intended for model training, and the portion intended for testing. The system proposes the classic 80/20 by default, but you have the option of choosing how you prefer to define this proportion.
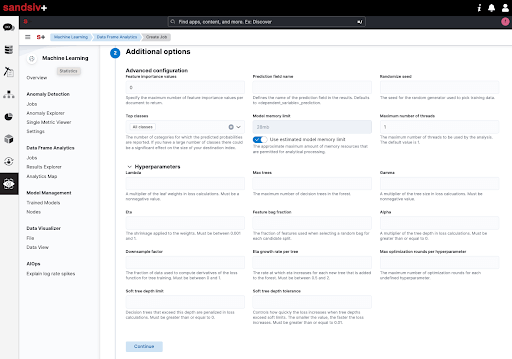
Within the “ADDITIONAL OPTIONS” section, I am provided with the opportunity to engage with the classification algorithm’s parameters. However, if the purpose of these parameters is unclear to me, it is advisable to avoid altering them 🙂. Those with more experience have the ability to modify these parameters to fine-tune the model as desired.
4. TRAINING TIME – MODEL BUILDING AND COMPARISON
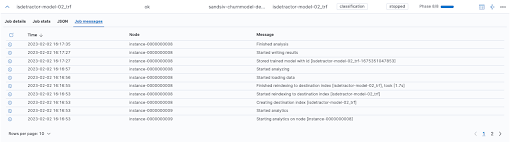
At this stage, all that is required is to input the specifics of the desired job or model. Upon reaching step 4, the system will validate the selections made and identify any necessary corrections. After ensuring the accuracy of the inputs, simply select the “CREATE” button, and the platform will generate the predictive model. The complete details of the model will subsequently be visible in the list of jobs.
4. PREDICTIONS AND MODEL EVALUATION
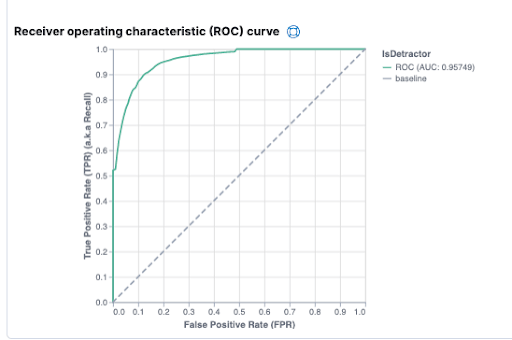
I can then view important information about the model in detail, such as:
The model’s ROC curve:
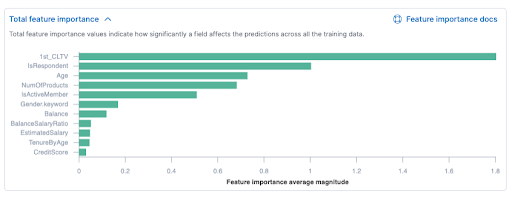
A visualization that will appeal to many users is the TOTAL FEATURE IMPORTANCE. In this view we see the list of our variables and the importance each has within the model to predict the answer to the problem we have just shaped, in our case is the customer a detractor?
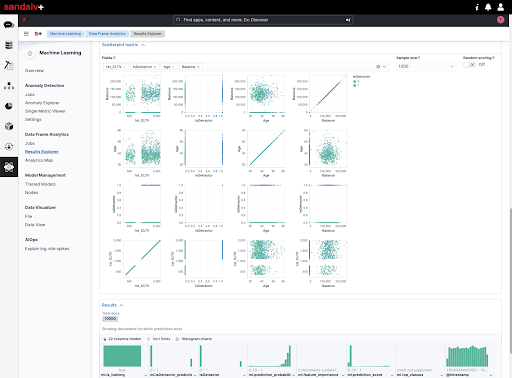
We then have the ability to view both the SCATTER PLOT MATRIX to understand the strength of the correlation between variables, and also the final result record by record, that is, on the individual client.
At this point the model can be immediately entered into the platform and run the predictive analytics jobs we want to entrust it with. Clearly, the analyzed records can follow a close-the-loop process like the one explained in the previous article.
IMPORT MODELS INTO THE PLATFORM
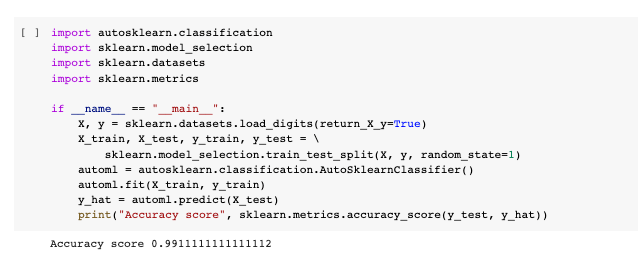
The Sandsiv+ platform provides the capability of importing models developed using other solutions into the platform. In an attempt to leverage this functionality, two models were created using two distinct Python libraries: Auto-sklearn and Autokeras, both of which are categorized as Automated Machine Learning (AutoML) tools. These tools automatically create a set of models and then recommend the best performing model to the end-user. This obviates the need for the user to manually set the model parameters during training.
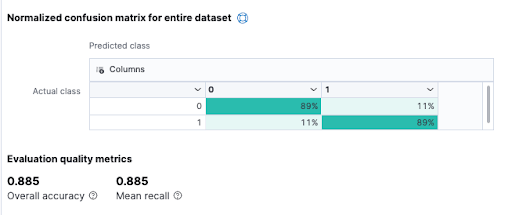
The outcomes of the two models generated were highly encouraging. The Autokeras model, which was based on TensorFlow, achieved an accuracy of 0.84, albeit with a significant error rate in predicting detractors. This resulted in higher contact costs, which did not pose a major issue in our specific scenario.
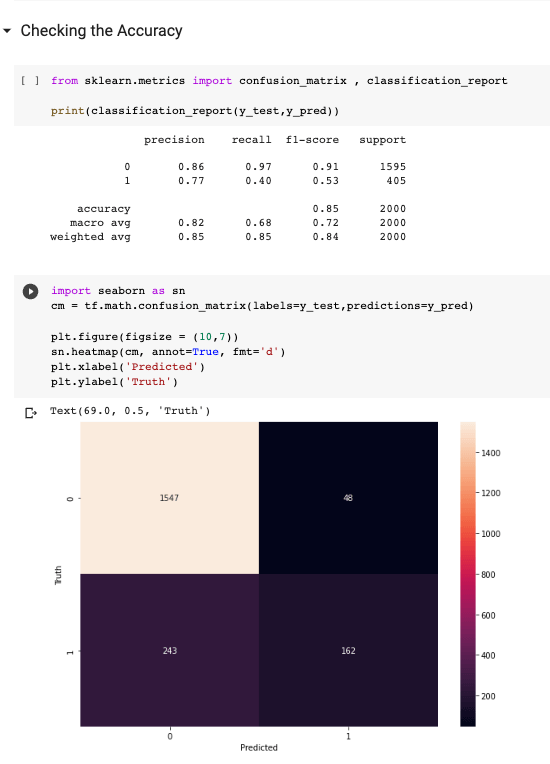
Conversely, the model generated by Auto-sklearn had an accuracy of 0.99, which raises concerns of overfitting, whereby the model has become too specialized to predict the problem, thus lacking the necessary level of generalization.
CONCLUSIONS
After conducting a thorough analysis of the sandsiv+ platform, it is evident that the creation of AI predictive models has been made more accessible and efficient. The platform’s no-code approach is a significant benefit for business professionals without data science knowledge, enabling them to build robust models with ease.
The ability to build predictive models on sandsiv+ offers numerous advantages for businesses looking to improve their customer experience. With the platform’s advanced data analytics capabilities, users can gain insights into their customers’ behavior and make informed decisions about the products and services they offer. Moreover, the platform’s predictive modeling tool can assist businesses in identifying detractors and promoters, helping them to address customer issues and improve satisfaction levels.
The sandsiv+ platform is designed to simplify the process of creating predictive models, making it accessible to a wider range of users. This no-code approach is not only more user-friendly but also ensures the consistency and accuracy of results. The platform’s ease of use means that users can create models quickly and with little or no input from data scientists. This is a significant benefit, as it enables businesses to react more quickly to changing customer needs and market conditions.
Furthermore, sandsiv+ offers a high level of flexibility, allowing users to create custom models that are tailored to their specific business needs. This customization ensures that the models are accurate and relevant to the business, leading to better decision-making and improved customer satisfaction.
In conclusion, the sandsiv+ platform offers a powerful solution for businesses looking to create AI predictive models. The platform’s no-code approach and advanced analytics capabilities make it easy for business professionals without data science knowledge to create robust models. With the ability to identify detractors and promoters, sandsiv+ can assist businesses in improving customer satisfaction levels and making informed decisions. The platform’s ease of use and flexibility ensure that the models created are accurate and relevant to the business, making sandsiv+ an excellent choice for businesses looking to gain a competitive edge in today’s market.